Algorithmic Trading and Stock analysis
Visualizes the stocks analysis simulating an algorithmic trading strategy.
Created on 28th August 2021
•
Algorithmic Trading and Stock analysis
Visualizes the stocks analysis simulating an algorithmic trading strategy.
The problem Algorithmic Trading and Stock analysis solves
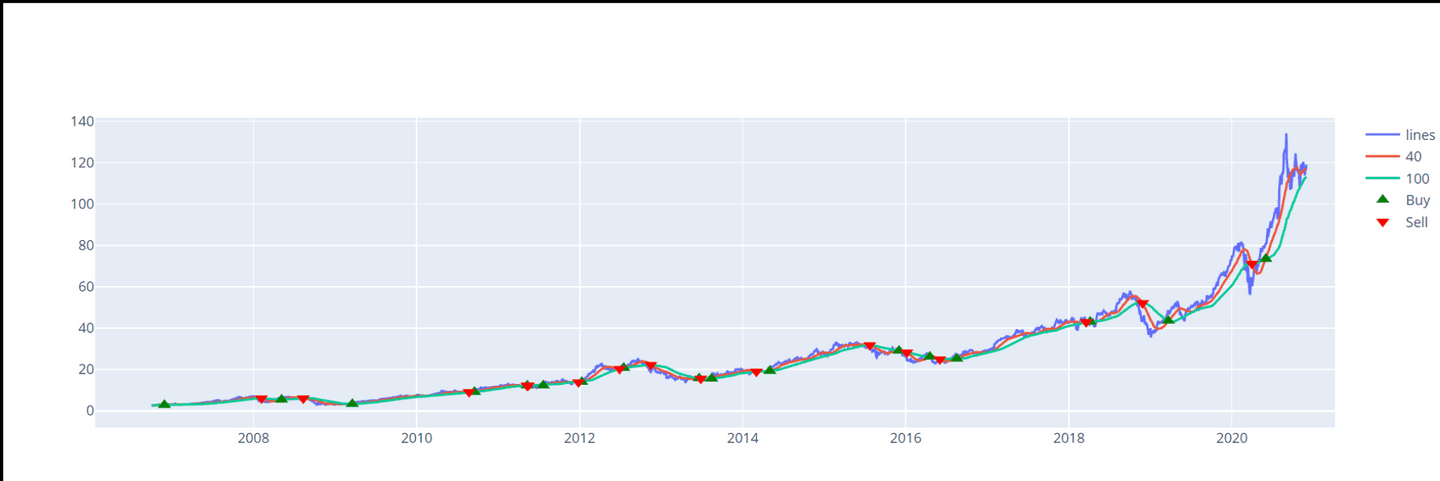
The dashboard is developed for visualizing the plots for stock analysis and getting the data as well. Interactive Plots are generated based on selected options such as moving averages, stock volatility, returns, cumulative returns, candlestick, etc. A Moving Average (Momentum based) algorithmic trading strategy is backtested and implemented with markers indicating buy and sell signal with a long and short moving average windows on the specified time period.
Challenges I ran into
In the process of dashboard development, for every graph returned from plotly as html the webpage reloads to render the graphs which can take a lot of time to reload a graph for different stocks and switching between graphs. Solved this issue by asynchronously displaying the graphs in the webpage using AJAX and JQuery. Also reduced the unnecessary calls made to the server and API.