GitHavior
Developer psychology matters. GitHavior builds a behavior profile of developers by aggregating their activity across GitHub, which can be useful for recruiters.
Created on 31st March 2019
•
GitHavior
Developer psychology matters. GitHavior builds a behavior profile of developers by aggregating their activity across GitHub, which can be useful for recruiters.


The problem GitHavior solves
Plenty of tools (like Sourcerer, gitfa.me, and so on) that extract developers' skillsets and tech choices using their GitHub profiles. However, there was no similar tool to extract their behavioral attributes using GitHub's data. As everyone in the tech community knows, even luminaries like Linus Torvalds can be at times be "jerks" and can hinder the productivity of other project collaborators. Thus, it has become important for companies to recognize whether a candidate is a right fit for their work culture and whether they fit the behavioral expectations of other employees, but there is no way to accomplish this at scale.
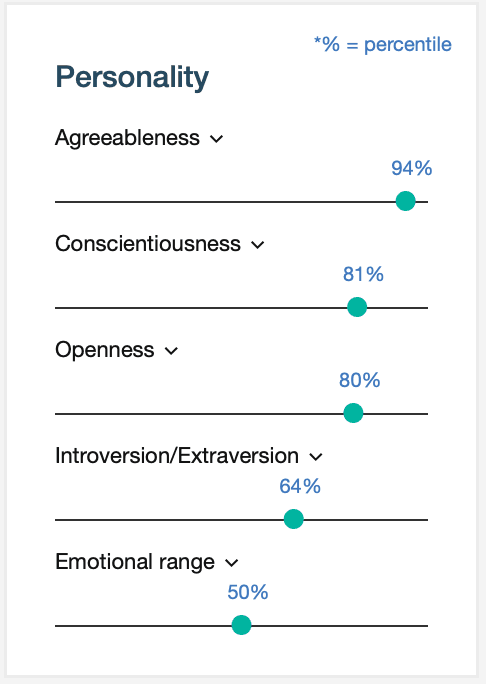
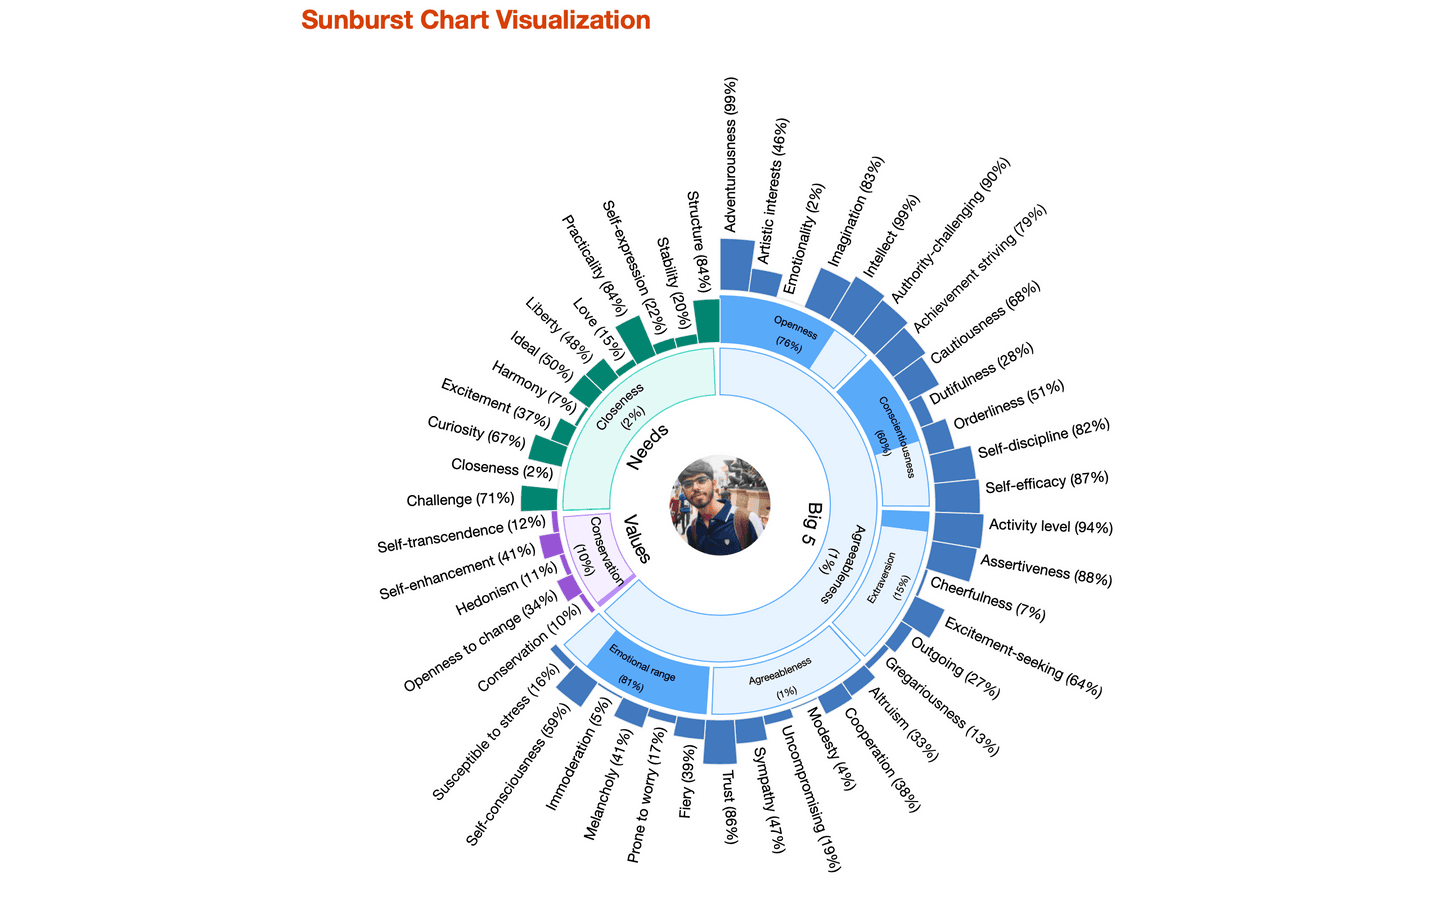
GitHavior attempts to address this, and builds a behavioral profile of a provided GitHub handle, by aggregating data from GitHub's API and processing it for later use by IBM Watson's Personality Insights API. It also uses IBM's Natural Language Understanding API for analysing the overall sentiment of a developer across GitHub throughout their open source journey.
The more active a developer is on GitHub, more accurate is the analysis provided by GitHavior. By providing significant insights into candidates' potential behavior patterns during work, GitHavior can be of great aid to recruiters, especially during the behavioral analysis of candidates.
Challenges we ran into
GitHub's API provides limited support when it comes to accessing a user's activity across all of GitHub, so we had to implement custom aggregators to gather a user's entire public activity data. The API is very repository-specific, NOT user-specific - there is extended support when one queries for a specific repository's data. This also meant that we often crossed the API rate limits and that hindered our prototyping speed.
Another challenge for us was integrating the frontend with our data processing pipeline at the backend. Since we don't have much experience with FE technologies, it was challenging for us to implement UIs and charts that visualized our data. We were able to create separate plots but we were not able to combine all of them into a single webpage.
Technologies used