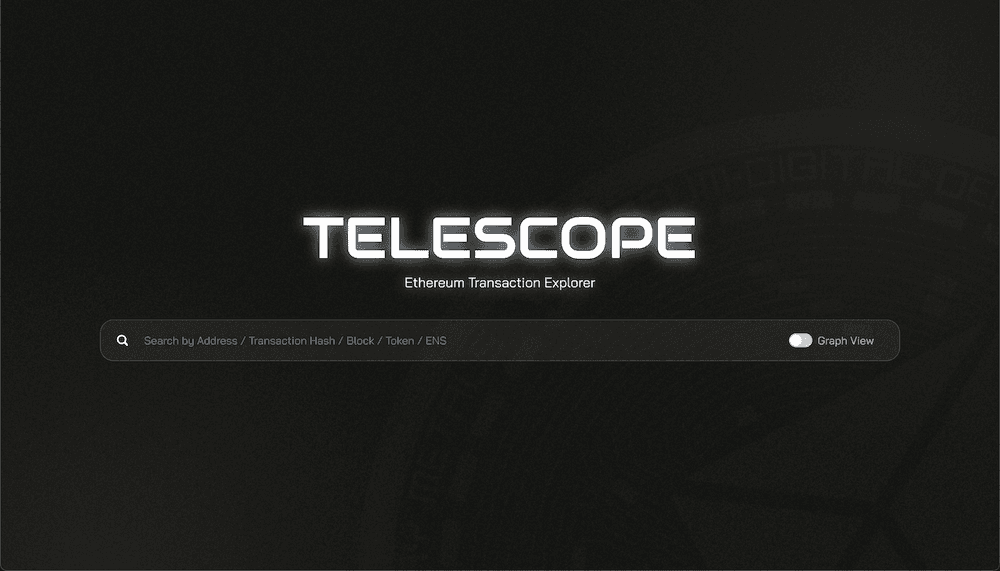
Telescope
Telescope is an Ethereum-native Transaction Explorer built to provide an enhanced user experience understanding the movement of funds on-chain.
Created on 17th September 2022
•
Telescope
Telescope is an Ethereum-native Transaction Explorer built to provide an enhanced user experience understanding the movement of funds on-chain.

The problem Telescope solves
Problem: Blockchain is a complex technology. If we want to onboard the next billion users to crypto, we can't expect everyone to fully understand its inner workings. Instead, we need to abstract complexity away from end users and provide a better user experience at an infrastructure layer.
A block explorer is core to Ethereum. It's often the go-to source of truth to follow the movement of funds. But what if not everyone is suited for all the complexity that a block explorer has to offer? Ultimately, all that the end user cares about are their transactions. And they care just enough high-level details to figure out where their money went.
Therefore, what I’ve built during this hackathon is Telescope, what I call a "Transaction Explorer". Think of an infrastructure one layer abstracted from a block explorer where transactions, not blocks, are first-class citizens. It's an explorer that anchors on providing the most intuitive, high-level understanding of the movement of funds on Ethereum with a strong focus on the user experience.
Core Features:
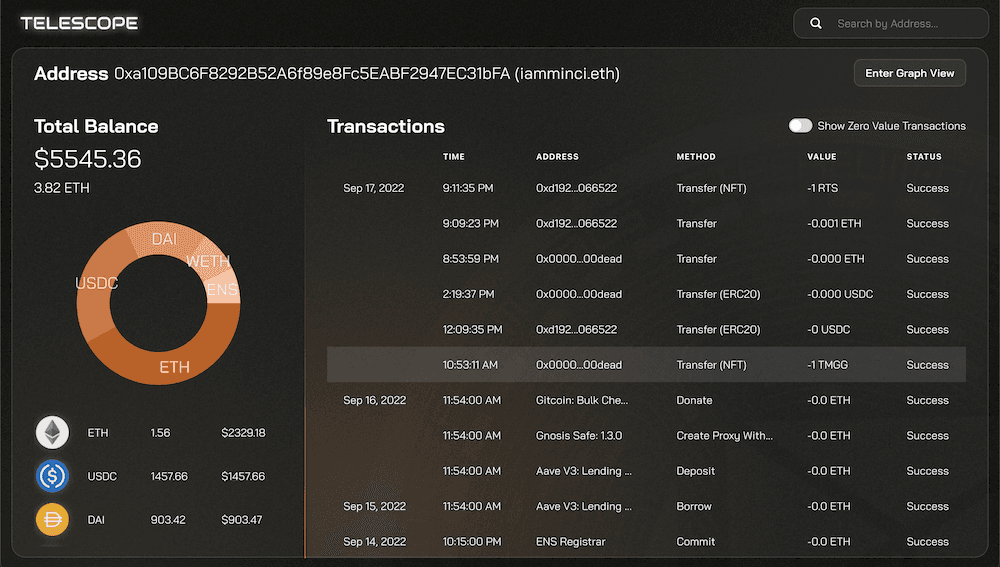
- Easy-to-follow account overview and transactions list (like a web2 banking app)
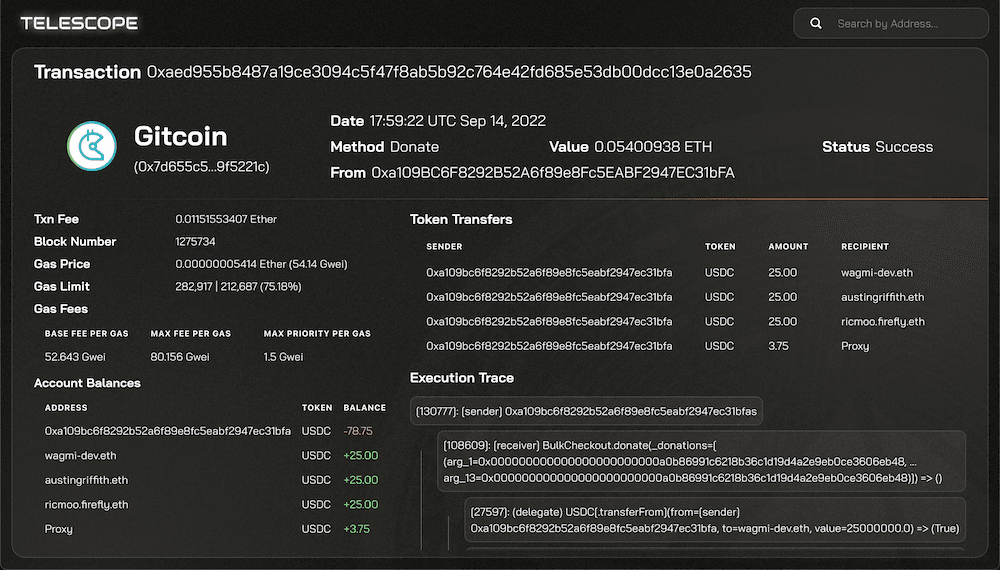
- Intuitive transaction detail page showcasing complex contract calls with ease
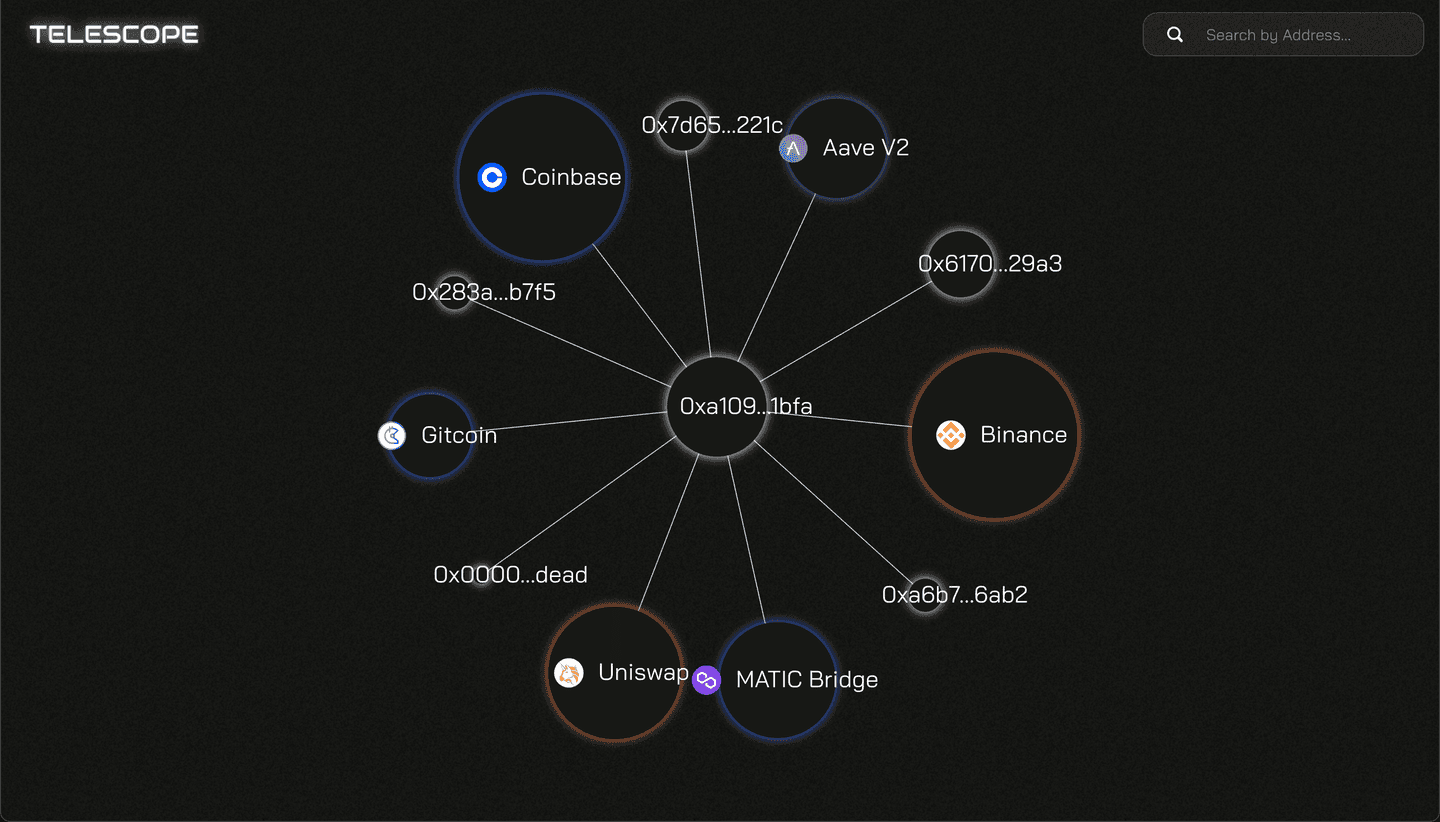
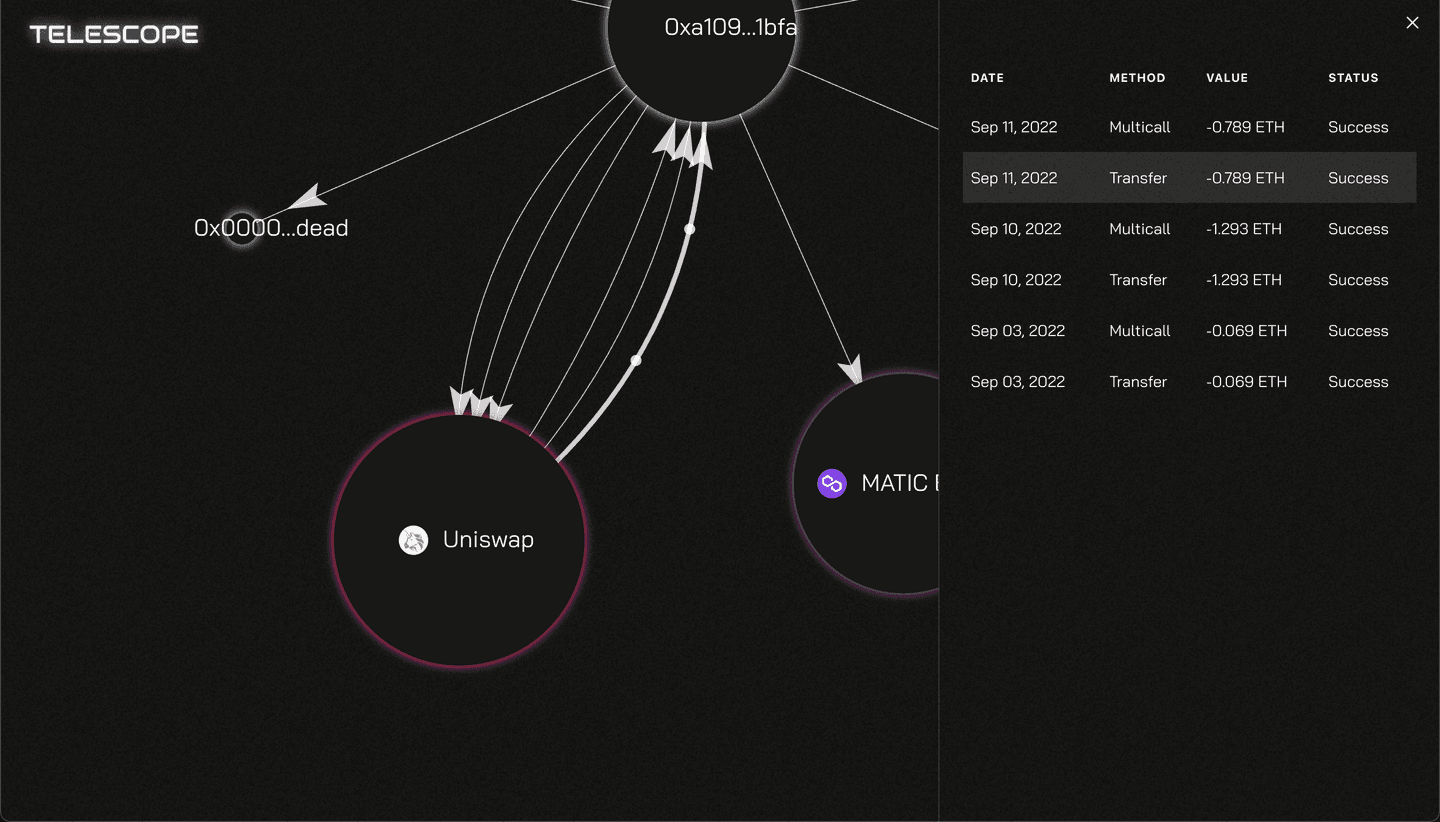
- Visualization of accounts and transactions in an aesthetic graph view
- Visualization of token and NFT transfers to better track movement of funds
- 3D Visualization of accounts and transactions to make this all the more "based"
Challenges I ran into
Data-piping and making shrewd UX decisions were the biggest challenge in this project.
For instance, Etherscan's API doesn't conveniently return all of a user's ERC20/ERC721 transfer, so I had to rely on Alchemy's API for those. As a result, I needed to build out an entire data processing layer in order to standardized the two outputs from the respective API's, which was not a very fun job :/ But as a result of the hard work, I was able to successfully show an aggregate transaction history for users!
For UX, I had to think from scratch how to (1) best visualize accounts and (2) think deeply about how to surface the most important high-level transaction details and how to best showcase the advanced details as well.
(1) Visualizing accounts involved making the decision that a graph would be the best form of visuals here then going out in the wild and finding the best graph visualization library (tried at least 5-6) then using the tools the library offered (react-force-graph, in this case) to customize it to the visuals that I hoped to achieve.
(2) For transaction details, I had to think hard about the pain points of Etherscan. Most prominently, for me, was the difficulty understanding "input data" for contract calls. I landed on showcasing token transfers and the execution trace as the most simple way to comprehend an advanced contract call.
Unfortunately I had to leave a lot of the features at the "proof of concept" stage due to running out of time. But I hope this submission demonstrates the vision at the least:)