
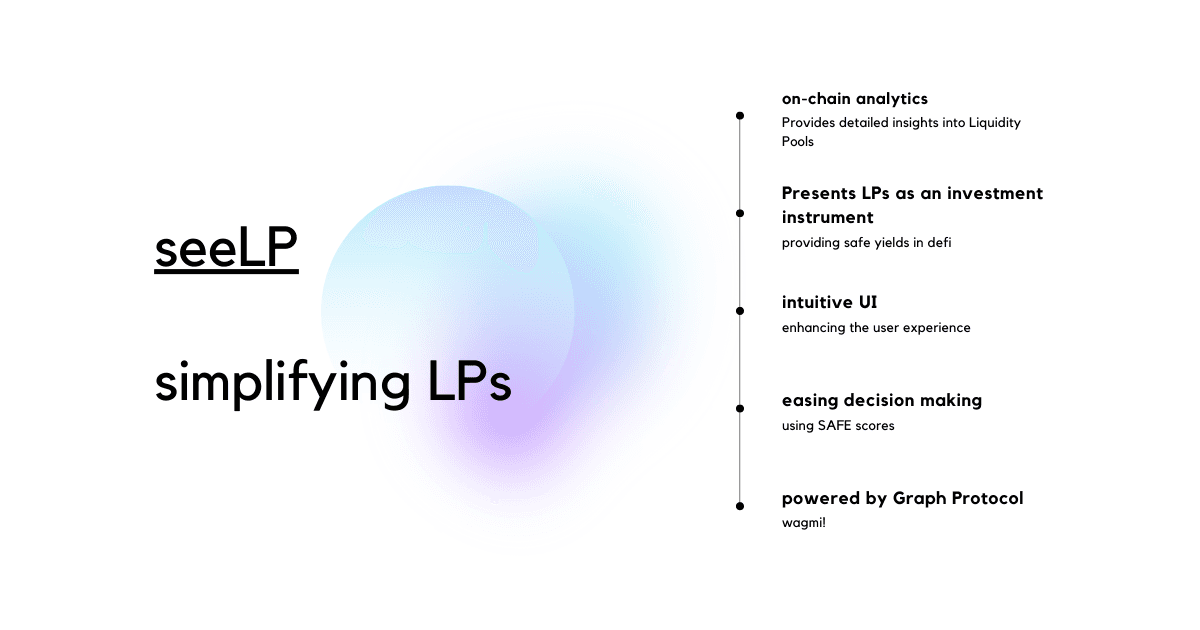
seeLP
" making LPs your buddies :)" - simplifying on-chain analytics for liquidity pools
Created on 28th August 2022
•
seeLP
" making LPs your buddies :)" - simplifying on-chain analytics for liquidity pools

The problem seeLP solves
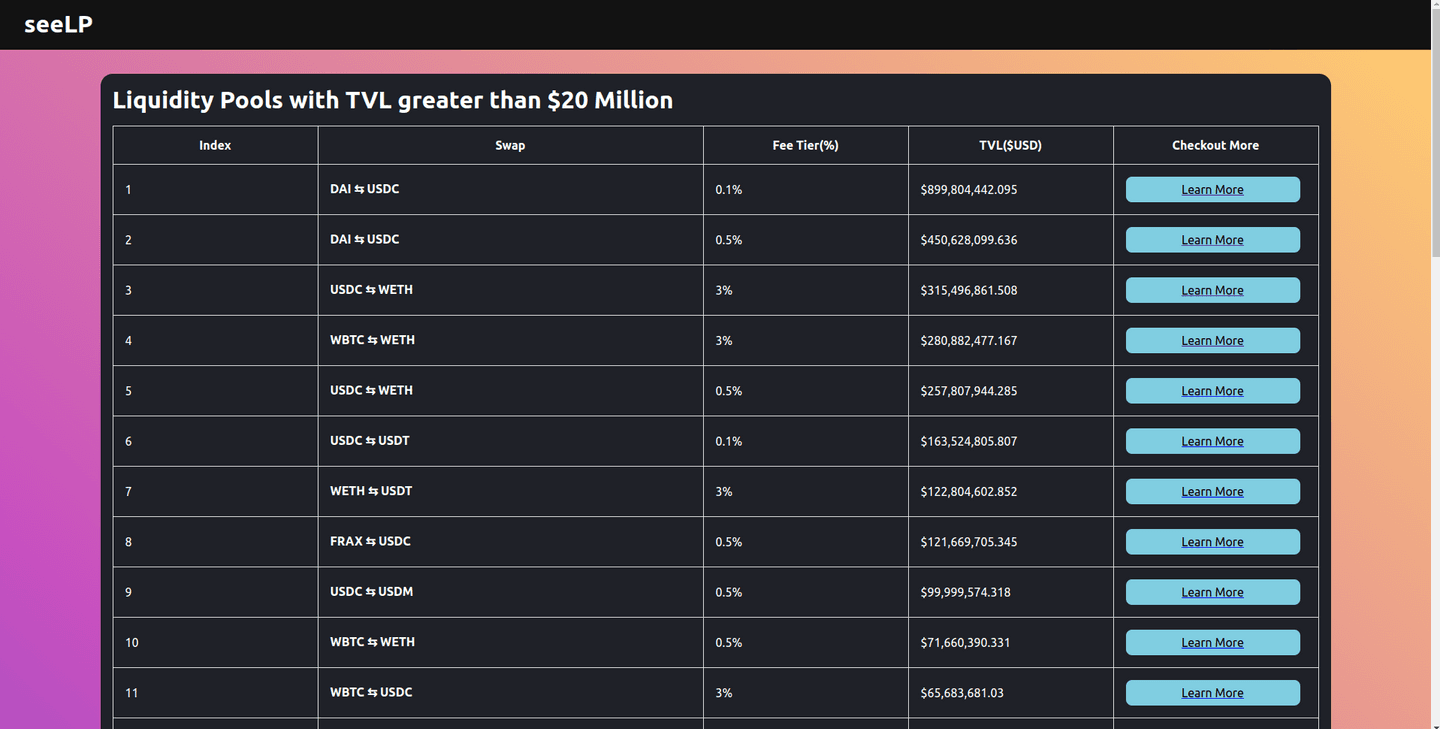
seeLP aims to make investing in liquidity pools easier by providing detailed analytics about them. This helps users to make an informed decision about and avoid investing in dodgy instruments.
- The three main data points used in seeLP are:
- Total Value Locked (TVL) : It is the overall value of crypto assets deposited in a decentralized finance (DeFi) protocol. In our case it refers to the total value of assets in the liquidity pool in USD.
- Volume Traded : This is the amount of assets swapped using the liquidity pool. This is important because, more swaps mean more earnings.
- Fee Tier : This refers to the fee-charged to the users and the fee earned by the in-range liquidity providers. There has to be a balance, to ensure LP users get a fair rate and providers get their fair share.
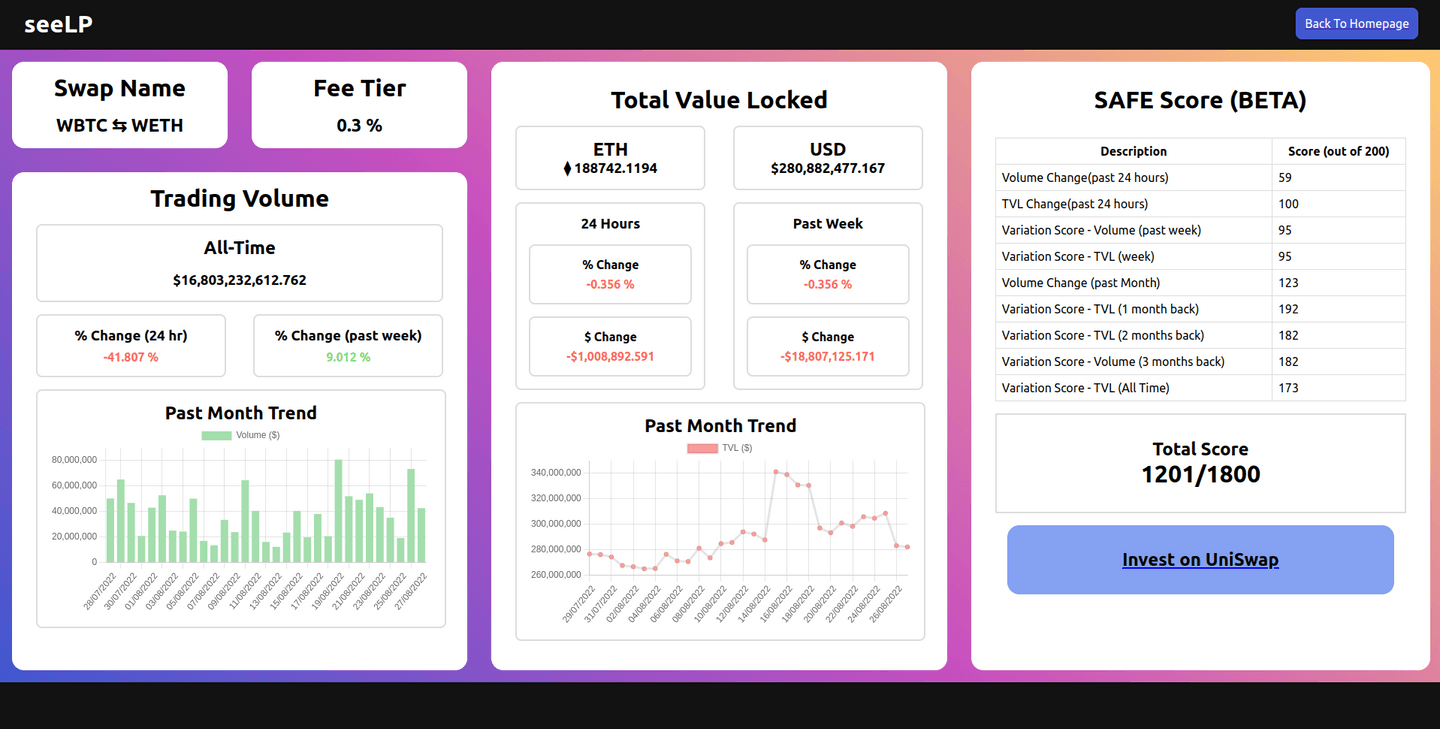
We also use custom statistics to provide users with more relevant insights
To list a few:
- TVL and volume over :
- past 24 hours (for seeing ultra short-term movement)
- past week (for seeing short-term movement)
- past month (for seeing long-term movement)
- past 3 months (for extended long-term movements)
- We use the change in dollar value, % change for the high level statistics
SAFE Score
still in experimentation phase, all feedback is welcome
- SAFE Score is used to provide users with a single-number to prevent confusion. It's goal is to boil down the heath of a Liquidity Pool to one number.
- It uses the following metrics :
- % Change in Volume and TVL over 24 hours and a week
- Variance Score : Variance score is a statistic used to determine how volatile the asset is in a particular time period.
- It uses the mean and the standardDeviation of the data, to create coefficient of variation.
- We then scale it to make it fit within our parameters.
- We want to provide stability to our investors, so high volatility is punished
Challenges I ran into
I ran into quite a few challenges, while building this project. It was a lot of help from the people here, that i was finally able to complete it.
Listing a few of them below,
- Finding a Data Source : I needed quick access to a large amount of custom data. After exploring REST APIs, Event Listeners, I finally settled on a subgraph for Uniswap, hosted on Graph Protocol. Mainly for the ease of requesting custom data structures.
- This provided me the quick and flexible access for my data needs.
- Querying the Data : I used the Apollo client over URQL because Apollo, provides an experience with more and easier control over queries.
- Deciding Statistics to Report: This was the part that required addition research, I referred to the Uniswap v3 whitepaper, to better understand terminologies and to decide the optimal statistics to report.
- Presenting the Data: My aim was to create a user experience that's pleasing to see, to increase the engagement with the platform.
- Censorship : To prevent a Tornade Cash situation, I deployed on IPFS through Spheron to prevent censorship for my application.
- First IRL Hackathon: It being my first experience coding for 24 hours straight, but the energy around me kept me going :)
Technologies used
Cheer Project
Cheering for a project means supporting a project you like with as little as 0.0025 ETH. Right now, you can Cheer using ETH on Arbitrum, Optimism and Base.
Discussion
Builders also viewed
See more projects on Devfolio