SafeNav
Know the risk before you take the road


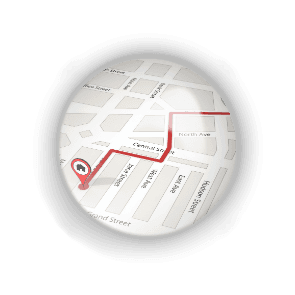
The problem SafeNav solves
The Core Challenge:
Urban commuting becomes hazardous and unpredictable during monsoon seasons. Heavy rainfall leads to sudden waterlogging and flash floods, turning familiar routes into dangerous traps. Standard navigation apps often prioritize the shortest path without accounting for real-time flood severity, leading vehicles into deep water, causing breakdowns, traffic gridlock, and significant safety risks.
SafeNav bridges this gap by treating "safety from waterlogging" as a critical navigation metric alongside distance and time.
🎯 Key Capabilities & Use Cases
🧠 Algorithmic Safety (Custom Dijkstra Implementation)
The Problem: Most safety routing is just a simple "avoid area" block. It doesn't calculate the trade-off between a 20km detour and a slightly wet road.
The Solution: SafeNav uses a custom Random Forest Classifier and Dijkstra’s Algorithm that calculates edge weights based on a formula: Distance × (1 + Flood Risk + Rain Intensity).
Use Case: It finds the "Safest Shortest Path". It won't send you on a massive detour for a minor puddle, but it will reroute you completely to avoid deep water. It mathematically balances safety vs. efficiency.
🗺️ Visualizing the Invisible (Risk Heatmaps)
The Problem: Flood warnings are often text-based ("Heavy rain in Sector 5") which is hard to visualize while driving.
The Solution: The Area Risk Insights and RiskMap components generate dynamic heatmaps.
Use Case: Users can look at the map and instantly see "Red Zones" (High Risk) overlaying the city. This allows for intuitive "at a glance" decision-making before even starting the car.
🤝 Community-Powered Intelligence (Crowdsourcing)
The Problem: Satellites and sensors can't see everything. A burst pipe or a blocked drain is often only known by locals.
The Solution: The Report Issue feature allows users to drop pins on waterlogged areas, which immediately updates the risk model for everyone else.
Use Case: If a user ahead of you reports "Knee-deep water," your route automatically adjusts to avoid that specific street, creating a Waze-like community safety net.
🤖 ML-Driven Predictive Analysis
The Problem: Rain doesn't always mean floods. It depends on drainage, topography, and soil.
The Solution: The backend uses Scikit-learn models (flood_risk_classifier & flood_severity_regressor) to analyze environmental factors and predict severity.
Use Case: It distinguishes between "wet roads" (safe to drive) and "severe waterlogging" (unsafe), preventing false alarms while catching real threats.
SafeNav isn't just a map; it's a survival tool not only for the monsoon but for all seasons and road hazards. By combining Dijkstra's algorithm for mathematical safety optimization, Machine Learning for risk prediction, and Crowdsourcing for real-time ground truth, it ensures that your journey is not just fast, but dry and safe.
Challenges we ran into
Building SafeNav was an ambitious journey that pushed us beyond simple CRUD operations into complex algorithms and AI integration. Here are the major hurdles we faced and how we overcame them:
The "Safest vs. Shortest" Algorithmic Dilemma
The Hurdle: Initially, our focus was purely on finding the safest path. However, our mentor challenged us: a safe path is useless if it takes 3 hours for a 20-minute trip. We needed to balance safety with efficiency.
The Solution: We implemented a custom Dijkstra’s Algorithm. Instead of standard distance weights, we created a composite "Edge Weight" formula. This formula mathematically weighs distance against flood risk and rain intensity. This allowed the system to find the "sweet spot"—a route that is significantly safer but not unreasonably longer.
Data Scarcity & Quality
The Hurdle: Finding a high-quality, real-world dataset for urban flood prediction was incredibly difficult. Public sensor data is often sparse or unstructured.
The Solution: We had to compromise and adapt. We sourced a "good enough" dataset from Kaggle to train our initial models. While not perfect, it allowed us to build a robust ML pipeline (ml_prep.ipynb) that can easily be retrained once better, localized data becomes available.
Testing "Rain" on a Sunny Day
The Hurdle: Our system relies on live weather data from the OpenWeather API to trigger warnings. Testing the "Monsoon Mode" features was difficult when the actual weather outside was clear and sunny.
The Solution: We had to build a robust testing environment where we could manually inject or mock weather parameters. This ensured our risk assessment logic worked correctly regardless of the actual forecast outside.
Infrastructure Costs vs. Hackathon Constraints
The Hurdle: Our mentor suggested adding a crowdsourcing feature where users upload images of hazards. However, cloud storage solutions (like AWS S3 or Cloudinary) usually require credit cards or paid tiers, which wasn't feasible for us.
The Solution: We engineered a local file storage system within our FastAPI backend. We save uploaded images directly to a local uploads/ directory and Firestore Database contains all the texts and serve them via static file mounting. This proved the concept perfectly without incurring infrastructure costs.
Moving from Hardcoded to Generative AI
The Hurdle: We initially hardcoded the "Severity Reasons" (e.g., "Risk is High because X"). It felt robotic and didn't account for complex combinations of factors.
The Solution: We integrated Google Gemini AI. Now, we pass the environmental parameters to Gemini, and it generates a dynamic, natural-language explanation of why a specific area is risky. This made the app feel much more intelligent and user-friendly.
Expanding the Scope of Hazards
The Hurdle: We started with just waterlogging. Our mentor pushed us to make it a complete safety app by including potholes, accidents, and road blockages.
The Solution: This required refactoring our database schema and frontend reporting forms. We created a flexible "Hazard Type" system that allows the map to render different icons and risk weights depending on whether the issue is a flood or a car accident.
The UI Challenge: Interactive Route Selection
The Hurdle: One of our biggest technical blockers was the map UI. We wanted to show multiple route options (e.g., "Route A: Fast but Risky" vs. "Route B: Safe but Slow") and let the user click to choose one.
The Outcome: Managing the state for multiple interactive GeoJSON layers in Leaflet proved to be extremely complex. While we successfully visualized the routes, making them fully interactive and selectable was a UX challenge we are still refining. It taught us a lot about the limitations of mapping libraries and state management.
Tracks Applied (2)
Best Innovation
AWS
AWS
Cheer Project
Cheering for a project means supporting a project you like with as little as 0.0025 ETH. Right now, you can Cheer using ETH on Arbitrum, Optimism and Base.