ETHIndia Partner Data Insights Analytics
Building Data-Driven Web3
Created on 4th December 2022
•
ETHIndia Partner Data Insights Analytics
Building Data-Driven Web3

The problem ETHIndia Partner Data Insights Analytics solves
Partner 1: Connext
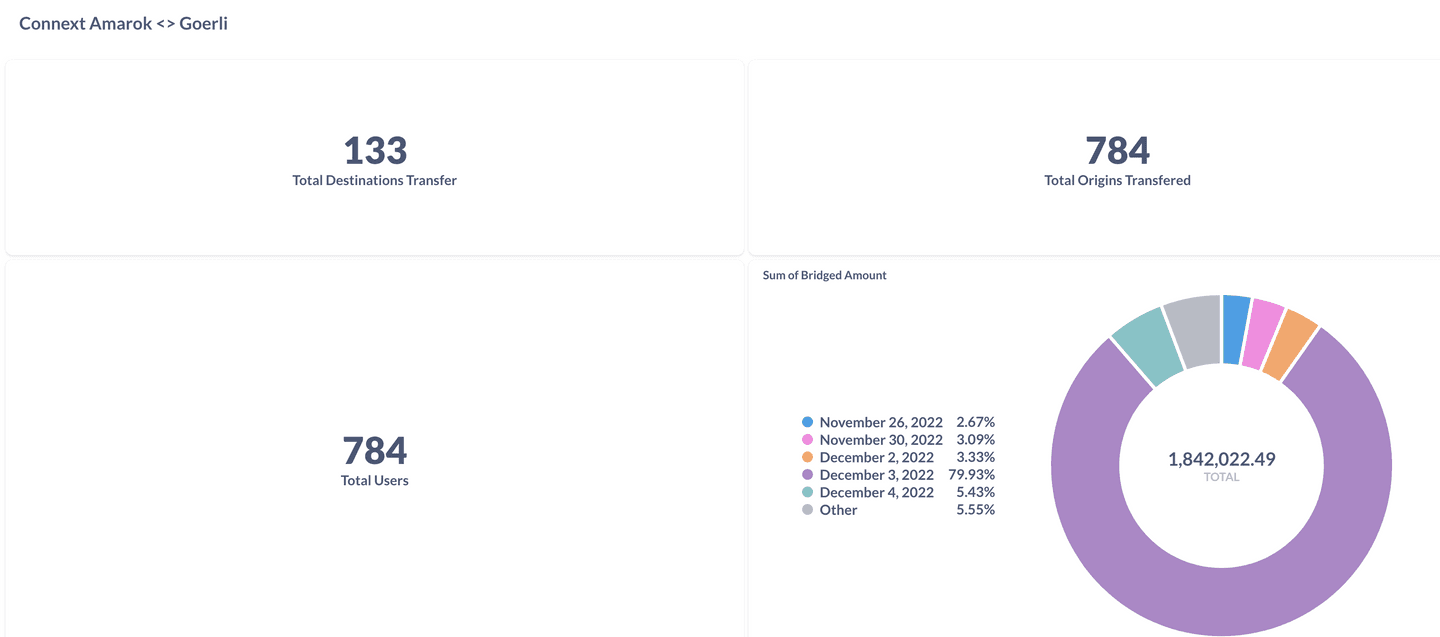
👉 Connext Amarok Goerli Bridge Analytics 👈
A bridge consists of two smart contracts: one on each chain that allows for cross-chain value transfers. On the sidechain, ETH deposited in the main net will provide a balance denominated in ERC-20 tokens.
Understanding how they are extremely crucial, extensively used and densely populated with various kinds of chains and tokens, It is imminent to track their data to get key insights on their data and important metrics can be covered using Analytics.
We present,
Connext Amarok Goerli Bridge Analytics Dashboard: http://analytics.dapplooker.com/public/dashboard/f179755d-aa0f-460a-8984-70c054e1c251
Important Metrics we covered here are:
of contracts
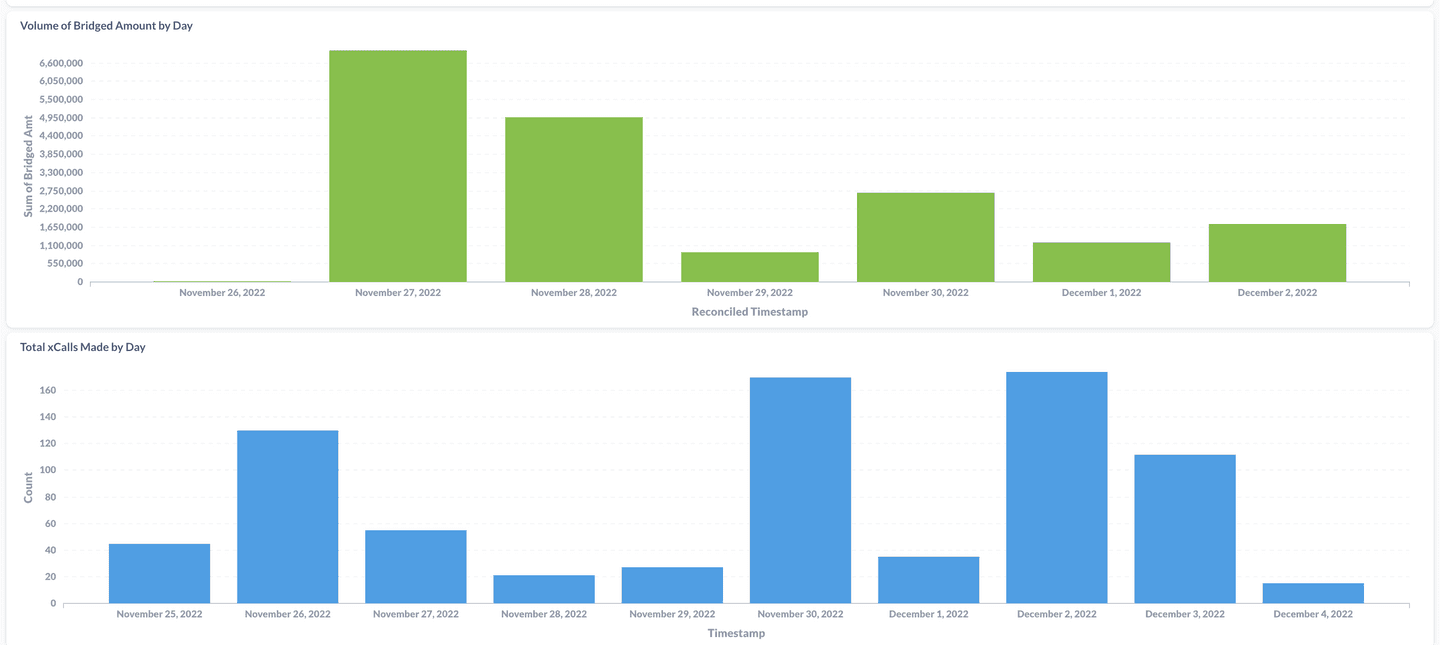
of xcalls
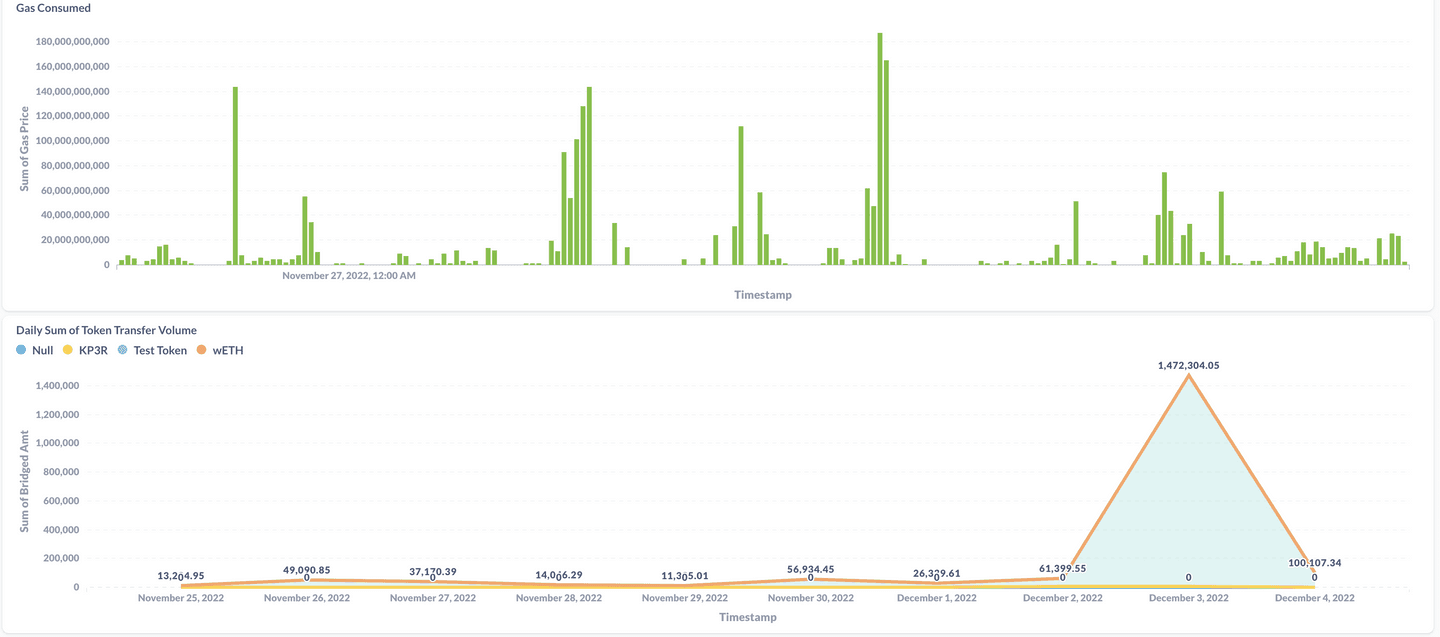
Volume
Ability to segment
Connext Amarok Goerli <> Interoperability on other chains
Benefits
Gives crucial idea about the liquidity, flow, token activity, gas fee
Helps monitor multiple bridges leaving from one network at one place
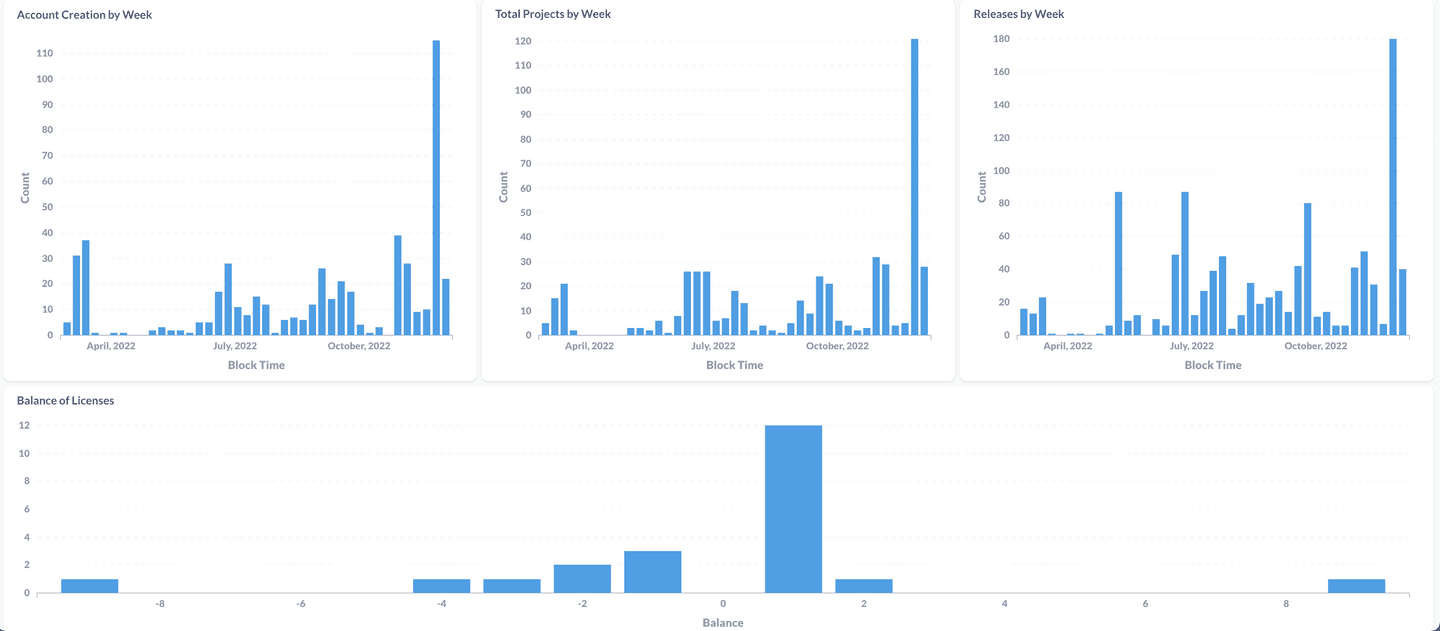
Partner 2: Valist
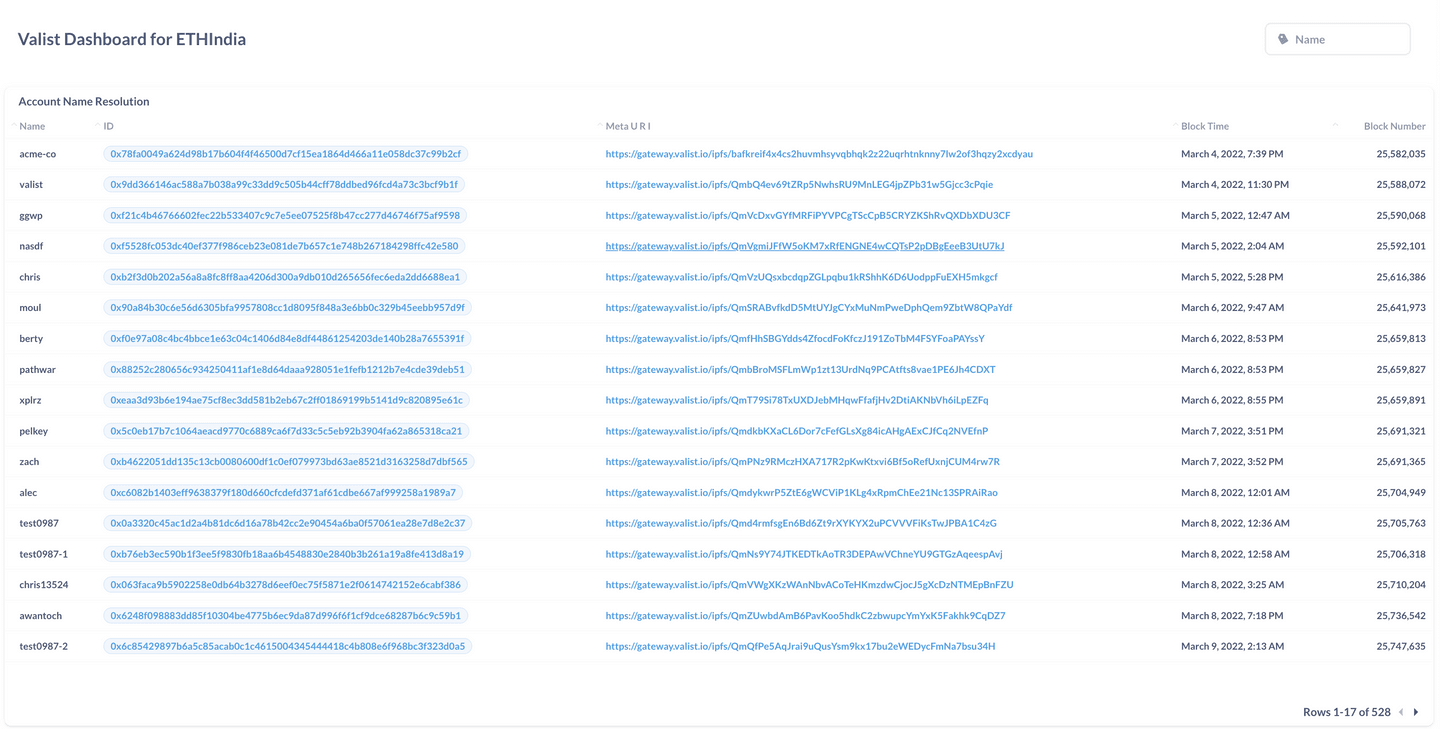
👉 Valist Data Explorer and Visualizer Mainnet | Testnet 👈
Easily ship web, desktop, and mobile software to any platform — all without managing complex tooling, infra, or using traditional DRM systems that take 30%+ of revenue.
The importance of analytics is simply to understand the adoption level of the network and how efficiently it works.
We present,
Valist Ecosystem Health Mainnet Dashboard: http://analytics.dapplooker.com/public/dashboard/5acf4564-76b2-4e39-adbc-e1edbf9a8f1a
Valist Ecosystem Health Testnet Dashboard: http://analytics.dapplooker.com/public/dashboard/e573e999-0d4a-4458-b5f4-0288066610fe
Important metrics we cover here:
Total Release
Total Project
Total Accounts
Benefits
Helps monitor the adoption level of the network and how efficiently it works.
Challenges we ran into
- Syncing of real-time data
- Integrating chart and dashboard API
Tracks Applied (2)
Connext

Connext
Valist

Valist
Technologies used
Cheer Project
Cheering for a project means supporting a project you like with as little as 0.0025 ETH. Right now, you can Cheer using ETH on Arbitrum, Optimism and Base.